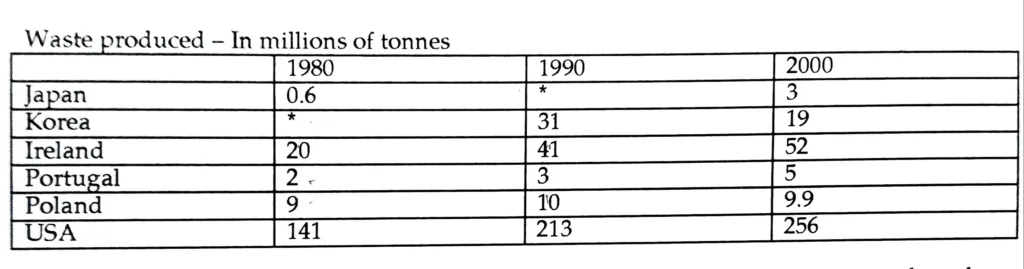
The graph shows the total amount of waste produced by cities and towns of six countries in 1980, 1990, and 2000. Summarise the information by selecting and reporting the main features and make comparisons where relevant.
The information is illustrated through a table that shows the total amount of garbage produced over a 20-year period (1980-2000) in million tonnes by urban areas in Japan, Korea, Ireland, Portugal, Poland, and the USA. Even a quick look at the table reveals that, for the specified time period, the United States of America produced the most waste.
Overall, out of the six countries, Japan produced the least amount of waste over the whole period, despite the fact that its waste output increased five times since 1980. On the other hand, America was on the top to generate rubbish.
Japan produced the least amount of waste (0.6 million tonnes) out of the six countries in 1980; however, the 1990 data is not available. Similarly, for Korea, no numbers are provided for 1980. Portugal and Poland produced slightly more waste between 1980 and 1990, going from 2 and 9 million tonnes to 3 and 10 million tonnes, respectively. From 141 million tonnes in 1980 to 213 million tonnes in 1990, America’s waste output rose significantly. Likewise, between 1980 and 1990, Ireland’s waste production increased dramatically from 20 to 41 million tonnes.
However, compared to the preceding decade, there was no significant increase in waste during 1990–2000. It’s interesting to note that Korea produced 19 million tonnes less waste in 2000 than it did in 1990 (31 million tonnes). The waste in Poland was essentially unchanged from 1990. The amount of waste produced increased moderately in the USA, Portugal, and Ireland to 256, 5, and 52 million tonnes.