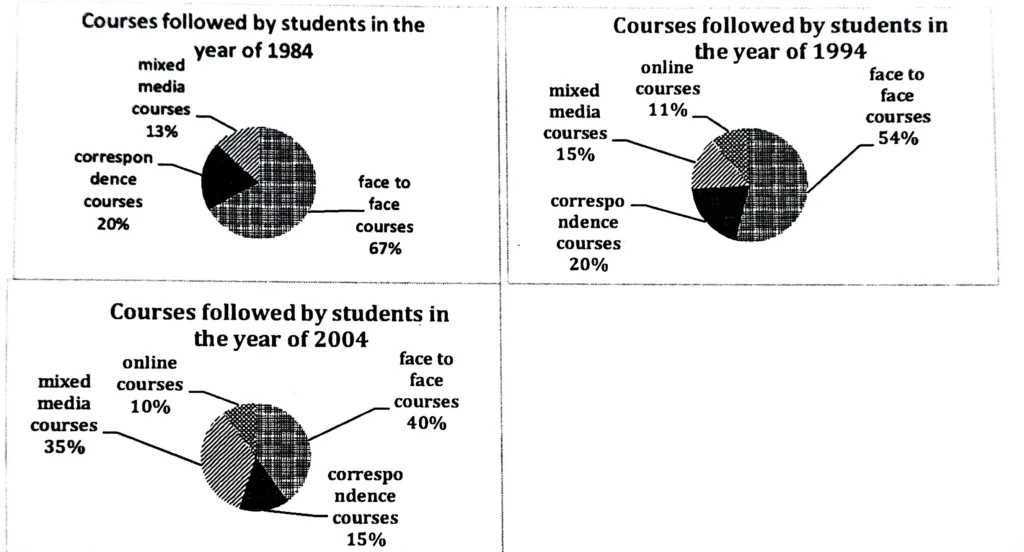
The pie charts below show the different types of courses that were followed by the students during the years 1984, 1994, and 2004. Summarize the information by selecting and reporting the main features, and make comparisons where relevant.
The student study courses (mixed-media, correspondence, online, and face-to-face) in 1984, 1994, and 2004 are contrasted in the pie charts that are provided. Obviously, some approaches became more popular than others. The data is computed in percentages.
Overall, the data indicates that while fewer students opted for the in-person approach over time, an increasing number of students did so for the multimedia courses.
The most common type of education in 1984 was in-person instruction, chosen by two-thirds (67%) of students. Thirteen percent of the students chose mixed-media courses, while twenty percent studied via correspondence.
The acceptance of correspondence courses remained steady in 1994. With 2% more students choosing them, mixed-media courses saw a small increase in popularity. The number of students choosing face-to-face instruction decreased by 13%, with 11% switching to online courses.
Three-quarters of students enrolled in mixed-media courses in 2004, when their popularity more than doubled. In 2004, face-to-face classes decreased even more, with 40% of students selecting them.