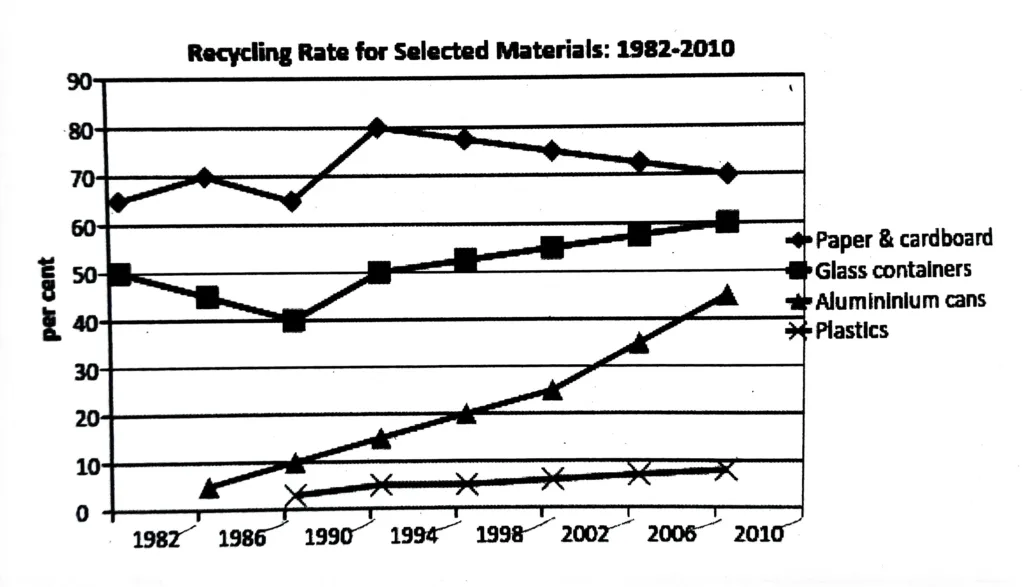
The graph shows the proportion of four different materials that were recycled from 1982 to 2010 in a particular country. Summarise the information by selecting and reporting the main features and make comparisons where relevant.
The graph illustrates the percentage of recycled paper and cardboard, glass bottles, aluminium cans, and plastics in a given nation from 1982 to 2010.
Overall, out of the four material classes, the highest percentage of recycled materials was made up of paper and cardboard; however, after 1994, this category’s recycling rate began to decline, while the amount of other materials recycled continued to rise.
Roughly 65 percent of cardboard and paper products were recycled in 1982. Before sharply increasing to a peak of 80% in 1994, this figure fluctuated. But from that point on, it dropped gradually, reaching a low point of 70% in 2010. Half of all glass containers were recycled in 1982; this percentage progressively rose to 60% by 2010 after falling to 40% in 1990.
In 1986, recycling rates for aluminium cans were only 5%; however, over the next 25 years, this percentage rose quickly, reaching 45% by 2010. In contrast, plastic recycling was not incorporated until 1990 and experienced a gradual increase from roughly 2% to 8% over that time. Still, growth in this category was steady.