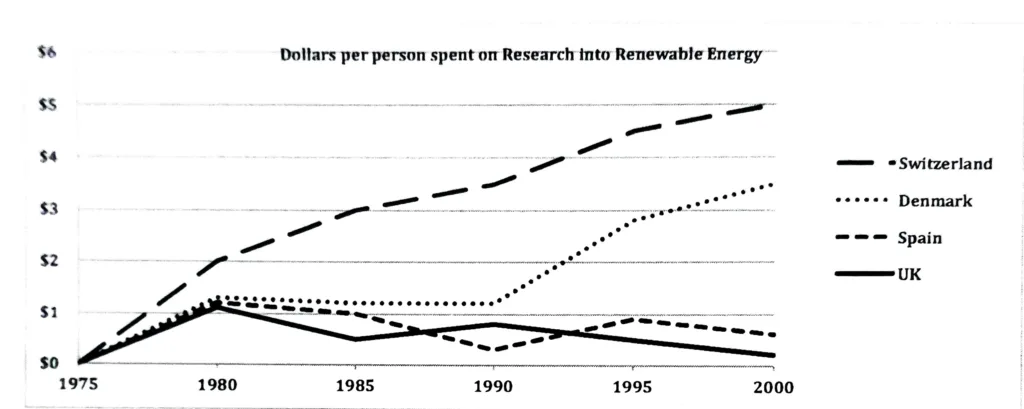
The graph shows the spending on research into renewable sources of energy in four countries between 1975 and 2000. Summarise the information by selecting and reporting the main features, and make comparisons where relevant.
The provided line graph shows the expenditure trends of four nations on renewable energy research between 1975 and 2000. The data is measured in dollars.
Overall, it is evident that the four nations invested different sums of money in researching renewable energy sources, but the Danish and Swiss invested the most during the whole time.
Switzerland’s research expenditures went from zero to two dollars per person between 1975 and 1980. From that point on, the amount increased gradually until it reached $5 per person by 2000. Conversely, with the exception of a brief period in 1990, when Spain spent the least, the UK spent the least during the entire period. The amount of money spent on research per British person fell to an all-time low of 0.2 dollars by 2000.
Regarding the other two nations, Spain spent marginally more on research than the UK, varying its budget by about $1 over the course of the study. In 1980, Denmark’s per capita spending was approximately $1.2 and stayed that way for ten years. The amount increased sharply starting in 1990 and peaked in 2000 at $3.5 per person.