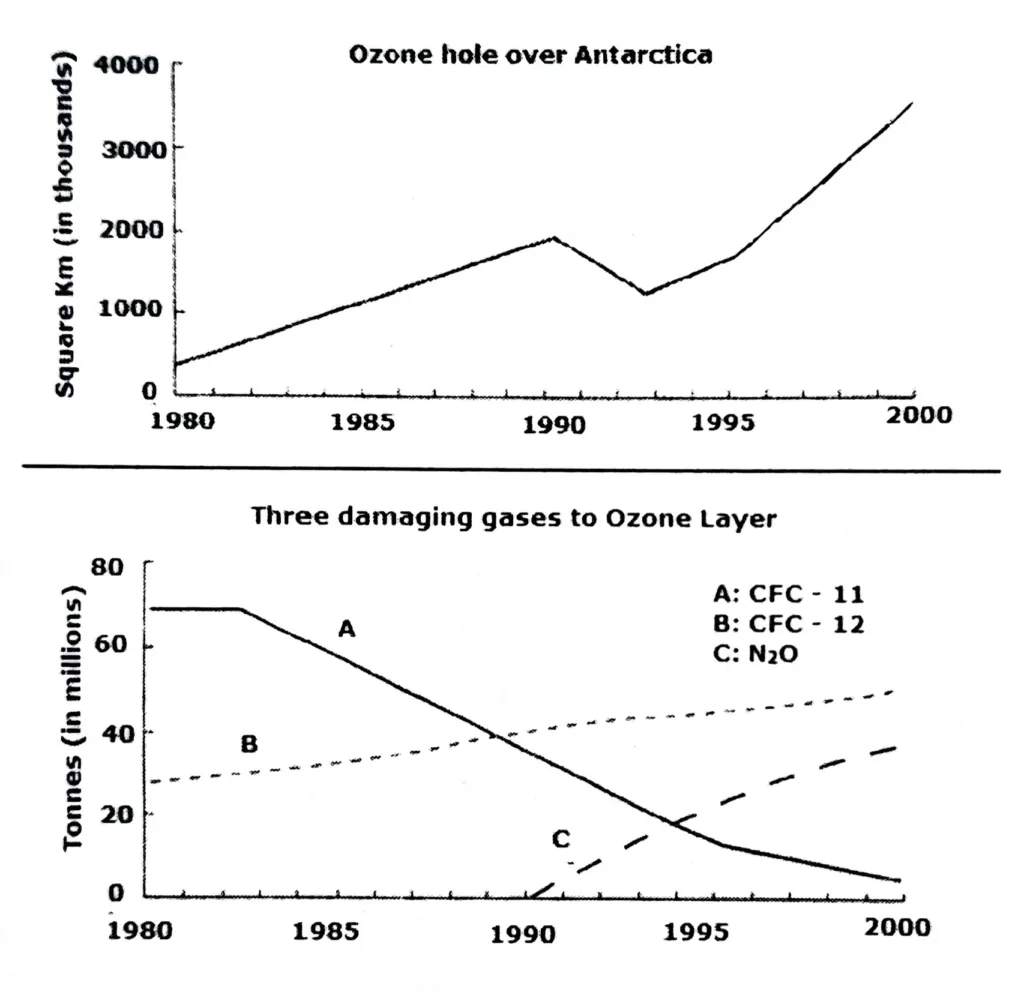
The graphs show the size of the ozone hole over Antarctica and the production of three ozone-damaging gases from 1980 to 2000. Summarise the information by selecting and reporting the main features, and make comparisons where relevant.
The provided line graphs show how the size of the ozone hole over the Antarctic region changed from 1980 to 2000, as well as how much of three gases were produced during that time that damaged the ozone layer.
In general, the two graphs show that the ozone hole over Antarctica expanded in the final two decades of the 20th century primarily due to CFC—12 and NO.
Twenty years later, the ozone hole had grown dramatically to 3.6 million square kilometres, from its minimum size of approximately 400 thousand square kilometres in 1980. It multiplied by nine. The early 1990s were the only time in which the area shrank, going from 2 million square kilometres to 1.2 million square kilometres.
Production of CFC-Il was estimated to be 70 million tonnes in 1980; this amount stabilised for three years before gradually declining to less than 10 million tonnes in the late 1990s. While CFC—Il production peaked in 1989, CFC—12 production increased over the course of a 20-year period, from 25 to 50 million tonnes. By 2000, however, NO production had increased significantly to approximately 40 million tonnes from its 1990 production level.