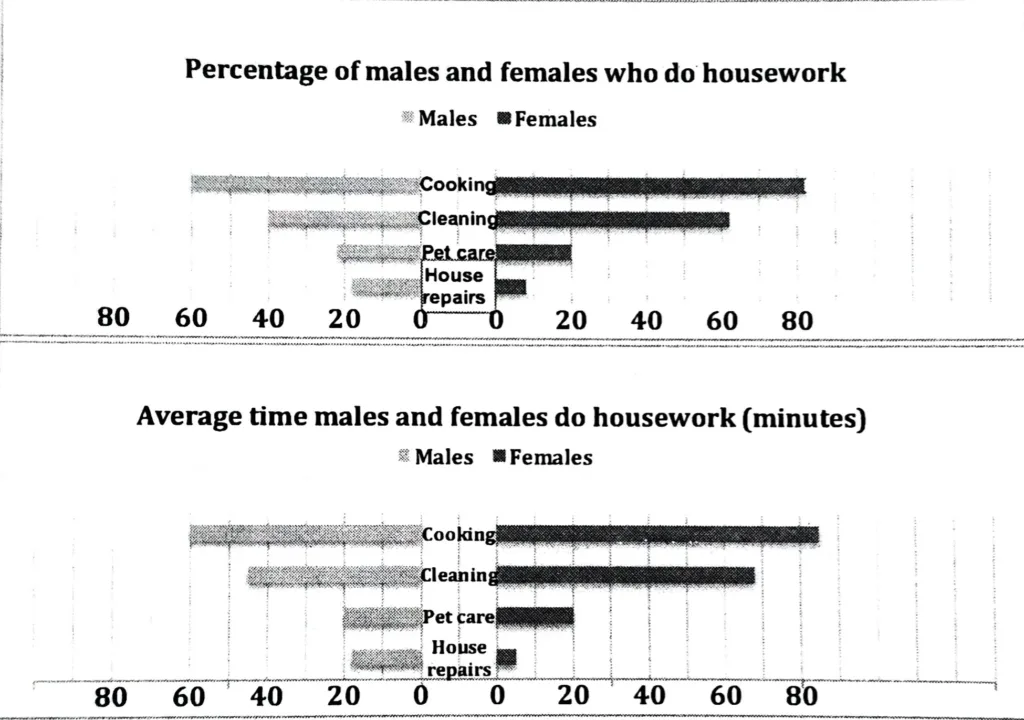
The first chart shows the percentages of women and men in a country involved in some kinds of home tasks (cooking, cleaning, pet caring, and repairing the house). The second chart shows the amount of time each gender spends on each task per day. Summarise the information by selecting and reporting the main features, and make comparisons where relevant.
Bar charts depict the percentage of men and women who clean the house and the amount of time each gender spends cleaning on average. These charts make it evident that more women than men perform cooking and cleaning duties, which also take up more time each day from both sexes than doing household repairs and pet care.
Overall, aside from house repairs, women take the lead in all of the assigned household chores.
Cooking and cleaning are performed more frequently by women than by men. Women participate in these two tasks at a rate of 80% and 60%, respectively, which is 20% higher than men. Men and women are involved in pet care in nearly equal proportions (20-22%). House repairs are performed by nearly twice as many men (18%) as women (9%).
Women outnumber men in terms of average time spent cooking and cleaning, spending approximately 20 minutes more on each task per day than men. Males and females both devote 20 minutes per day to pet care. Women spend about 5 minutes per day on house repairs, whereas men spend three times as much.


