The charts give information about the amount and types of water in the world and also describe the use of water in three areas in three countries. Summarise the information by selecting and reporting the main features and make comparisons where relevant.
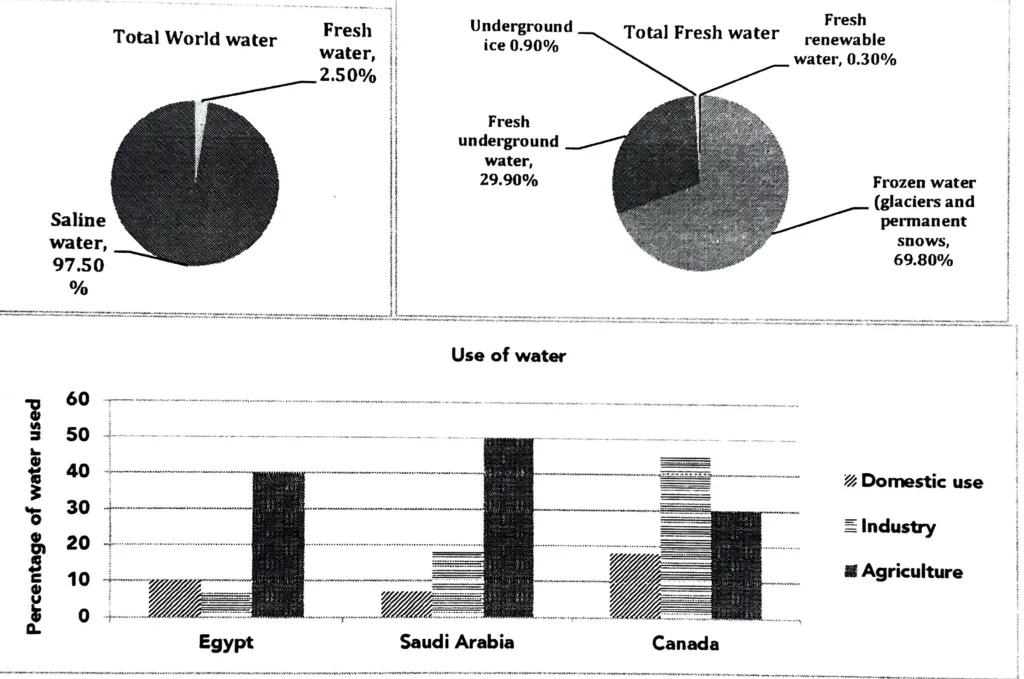
The provided column graph shows the percentage of fresh water used for each of the three purposes in Egypt, Saudi Arabia, and Canada, while the pie charts show the amount and types of water in the world.
Overall, only 2.5% of the water on Earth is fresh, and of that, only a very small portion is usable water that is used for home, industrial, and agricultural purposes. This makes fresh water an extremely valuable resource.
It is clear from the first pie chart that fresh water makes up the remaining 2.5 percent of the world’s water, with saline water making up the majority (97.50%). A little less than one-third (29.90%) is fresh subterranean water, while slightly over two-thirds (69.80%) are frozen water in the form of glaciers and permanent snows. Only a very tiny portion—0.30%—of fresh water is renewable fresh water, while the remaining 0.90% is subsurface ice.
According to the column graph, the largest use of water in Egypt is agriculture, accounting for 40% of total use. In contrast, domestic and industrial uses of water account for only 10% and 8% of total use, respectively. Furthermore, Saudi Arabia utilised 50% of the available water for farming. Compared to the Egyptians, they utilised more than twice as much water (18% of it) for the industry. For domestic use, Saudi Arabians utilised just 8%. Remarkably, Canadian industry used the highest percentage of water (47%) of all countries. About 18% was utilised in their households, whereas 30% was used for farming.