
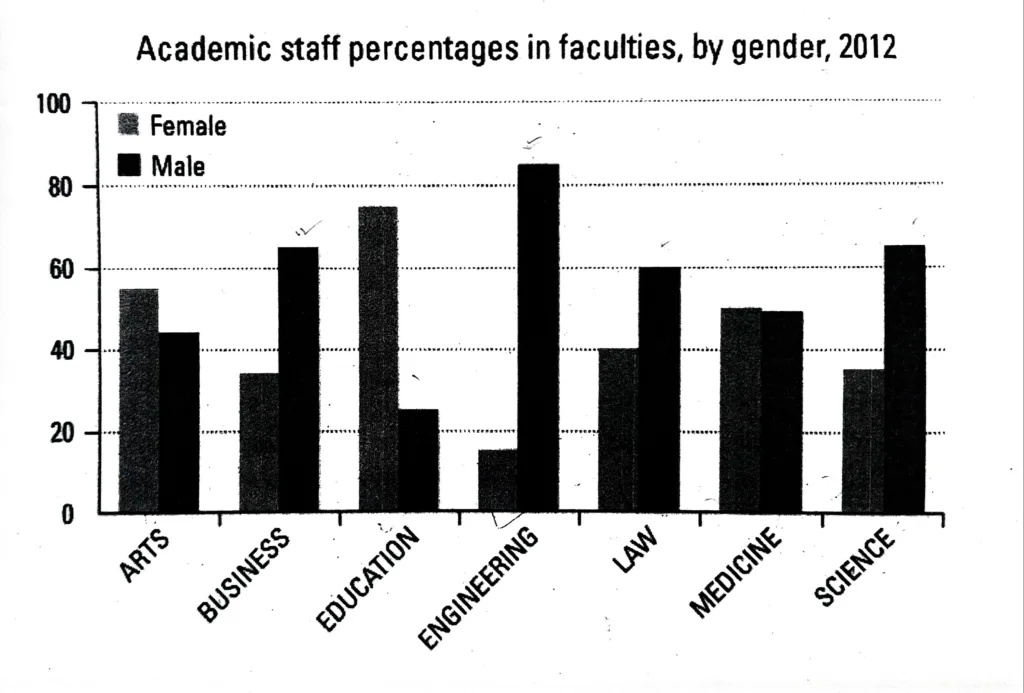
The graph shows the percentage of male and female academic staff members across the faculties of a major university in 2012. Summarise the information by selecting and reporting the main features, and make comparisons where relevant.
The ratio of male to female instructors across seven faculties at a given university in 2012 is displayed in a bar chart.
Within some faculties, there was a marked gender gap: the majority of academics in engineering were men, while the highest proportion of women were in education. Remarkably, there were 15% of female engineering instructors and 85% of male instructors. Within the education sector, women made up 75% of the academic staff, while men made up 25%.
Other faculties’ composition was more evenly distributed, though. While the proportion of women in academics was slightly over half (55%) in the arts, it was nearly equal in medicine. Remarkably, the percentage of men and women in the faculty of business and science was the same: 65% of the professors were men and 35% were women. With 40% of the total, Law had a marginally higher proportion of women.
While women still made up half of the faculty of medicine in 2012, they were predominant in education and the arts, and they still dominated the faculties of engineering, business, science, and law.
