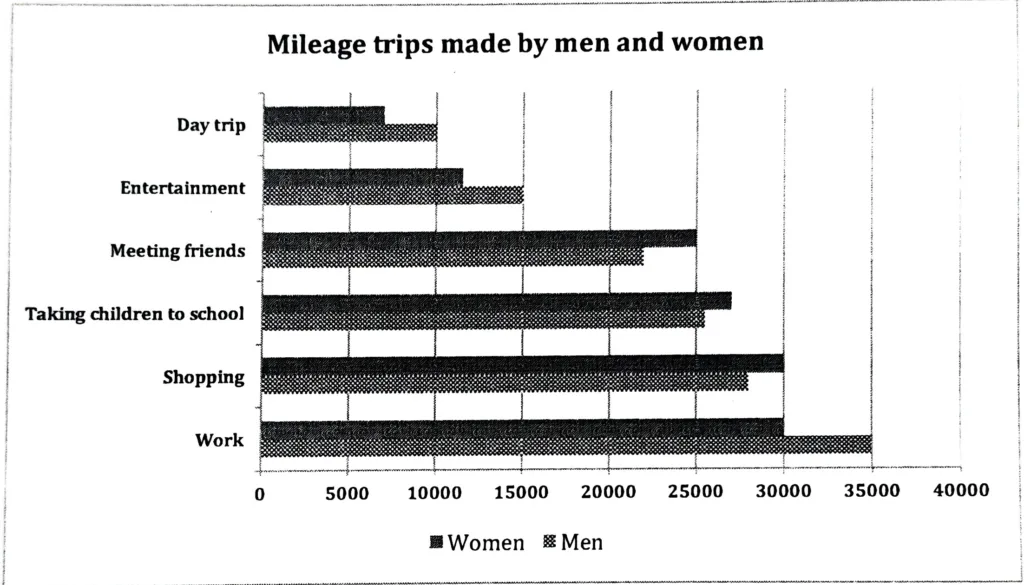
The bar chart shows the number of miles travelled in a year by men and women for six different purposes in a particular country. Summarise the information by selecting and reporting the main features, and make comparisons where relevant.
The provided bar graph displays the total miles driven by both genders each year for various purposes. Men obviously travelled more for work, entertainment, and meeting friends, while women travelled more for shopping, socialising, and dropping off kids at school.
Overall, when it comes to driving children to school, there is generally the least difference in the distance travelled by the two sexes. Just 2000 fewer miles were travelled by men than by women in order to transport their children to school—a difference of 26,000 miles.
In comparison to the thirty thousand miles travelled by women, men travelled approximately 35000 miles for work. On the other hand, for both genders, taking a day trip was the least preferred route. For this reason, men travelled 10,000 miles and women 7000 miles.
For female travellers, shopping and friend-seeking were the more common motives. For these two purposes, they travelled thirty thousand and twenty thousand miles, respectively, while men travelled twenty thousand and two thousand miles, respectively.