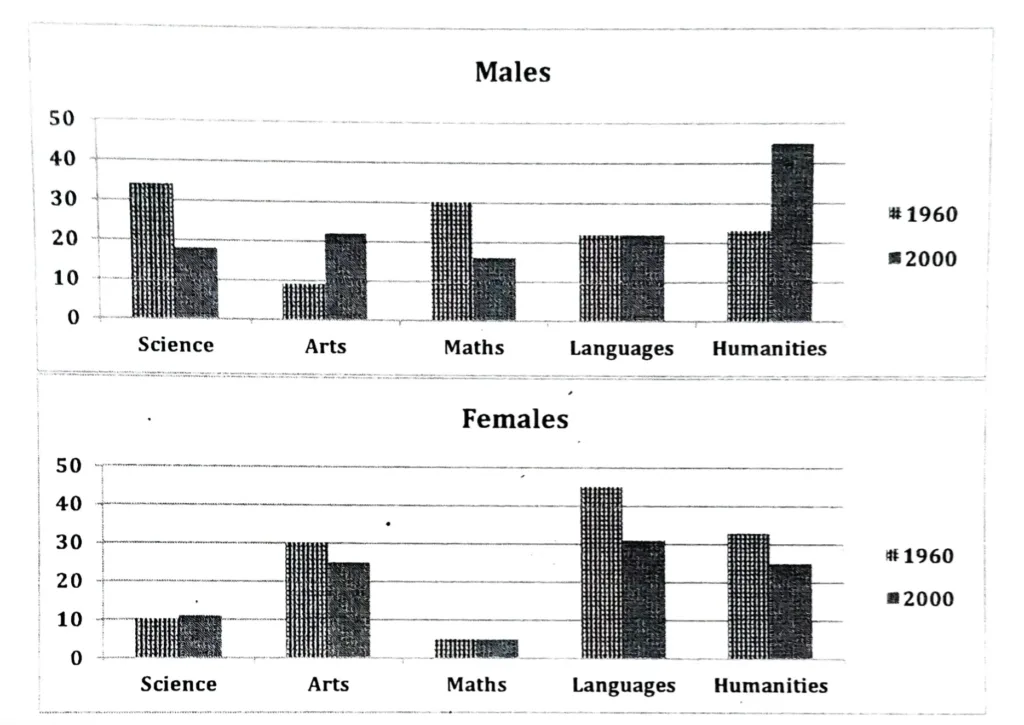
The charts show the percentage of male and female students getting top grades in 1960 and 2000. Summarise the information by selecting and reporting the main features, and make comparisons where relevant.
In 1960 and 2000, the percentage of boys and girls who received the highest grades in five subjects—science, arts, math, languages, and humanities—is contrasted in the column graphs provided.
In 1960, 20% of boys achieved high scores in languages and the humanities, while slightly over 30% of boys excelled in maths and science. Merely 10% of the participants achieved a high score in the arts. Girls, on the other hand, performed significantly better in the humanities, arts, and languages, earning high scores in these areas in 45%, 32%, and 30% of cases, respectively. Girls scored the lowest (5%) in maths and only 10% in science.
Compared to 1960, the proportion of boys who excelled in the humanities and arts nearly doubled in 2000, while the proportion in science and math decreased by about half. The proportion of top language scorers did not change. However, among girls, the share of top scorers in science and math stayed constant, while the share in the arts, languages, and humanities declined somewhat.
In general, it is unexpected to learn that in the humanities in 2000, boys outperformed girls. Moreover, boys did better in science and maths during the specified years, while girls did better in the arts and languages.