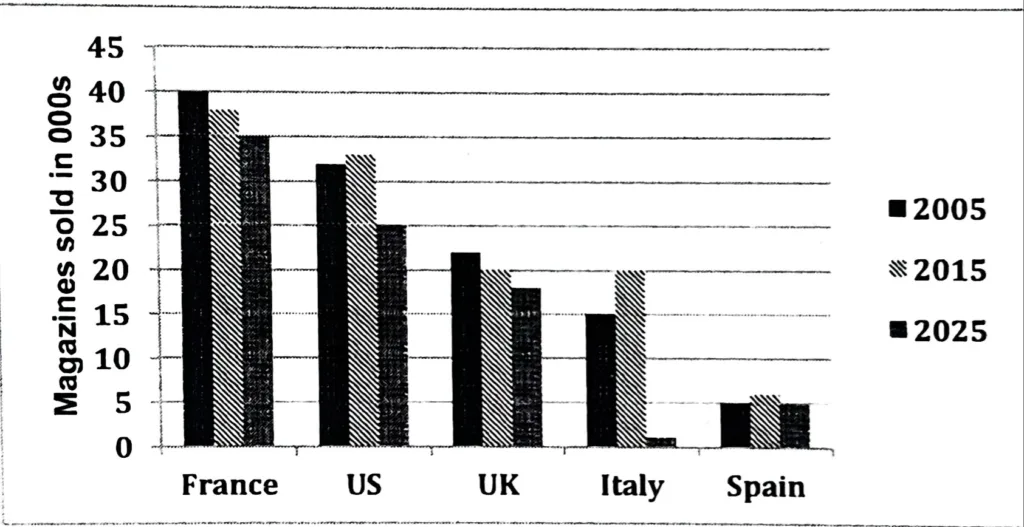
The graph below shows the number of magazines sold in five different countries in 2005 and 2015. A prediction for 2025 is also given. Summarize the information by selecting and reporting the main points, and make comparisons where relevant.
The provided column graph shows the quantity of magazines sold in five nations between 2005 and 2015, along with an estimate for 2025. The graph makes it evident that magazine sales fell in France and the UK between 2005 and 2015 and are expected to continue to decline going forward. Though sales of magazines rose in the US, Italy, and Spain between 2005 and 2015, a decline is anticipated by 2025.
It was predicted that until 2025, French readers of magazines would continue to be the most devoted. In 2005, there were 40,000 magazines sold in France; by 2015, that number had dropped to about 37,500, and by 2025, it is expected to have further declined to 35,000. Although the quantity of magazines sold in the UK was much lower than in France, the general pattern remained the same. In the UK, 22,000 magazines were sold in 2005; however, by 2025, that number is expected to drop to just 18,000 copies.
Spain sold the fewest number of magazines (5,000) ever in 2005, and after a modest increase in 2015, it is expected to reach 5,000 by 2025 once more. 2005 saw the second-highest number of magazines sold in the US, but by 2025, sales are predicted to drop to 25,000 once more. The forecast for Italy is the most startling. It is estimated that by 2025, there will only be 1,000 magazines sold, down from 15,000 in 2005 and 20,000 in 2015.
In general, the Spanish sold the least amount, while the French sold the most, and by 2025, this trend is anticipated to continue.