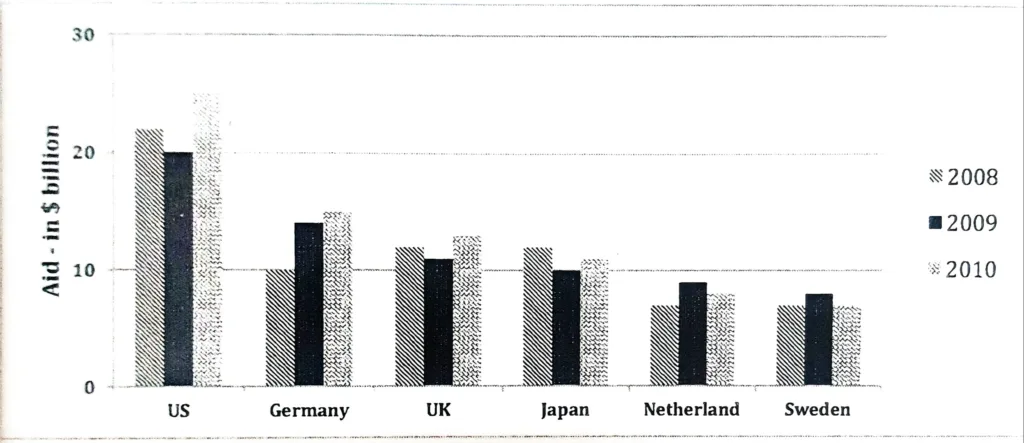
The chart below shows the aid from six developed countries to developing countries from 2008-2010. Summarize the information by selecting and reporting the main features, and make comparisons where relevant.
The information is depicted in the form of a bar graph, which illustrates the amount of help supplied by six industrialized nations (the US, Germany, the UK, Japan, the Netherlands, and Sweden) to developing nations from 2000 to 2010, which is calculated in billions of dollars.
‘The United States contributed the greatest help in all three years, and despite a modest decrease in 2009 from 22 to 20 billion dollars, the total increased to $25 billion in 2010. Germany, the United Kingdom, and Japan were the other three main donors, each contributing between $10 and $15 billion.
It’s worth noting that Germany’s aid had consistently grown throughout the years, whilst the other two’s aid had fluctuated. The help from the Netherlands and Sweden was always less than $10 billion, although the amounts changed over the course of three years.
Altogether, while the United States provided the greatest assistance to the developing world, most nations’ aid varied over three years. Germany, on the other hand, was the only country that witnessed continuous growth.