IELTS WRITING TASK 1 – PIE CHART
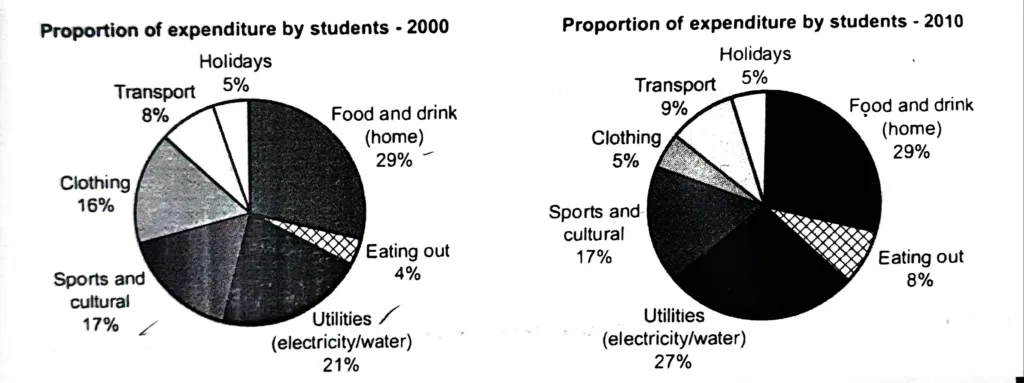
The charts show the proportion of expenditure by students, on average, at one university in 2000 and 2010. Summarise the information by selecting and reporting the main features, and make comparisons where relevant. The two pie charts compare the proportion of student expenditure in six categories in the years 2000 and 2010. These categories […]