COMBINATION

IELTS WRITING TASK 1 - COMBINATION
COMBINATION

IELTS WRITING TASK 1 – COMBINATION

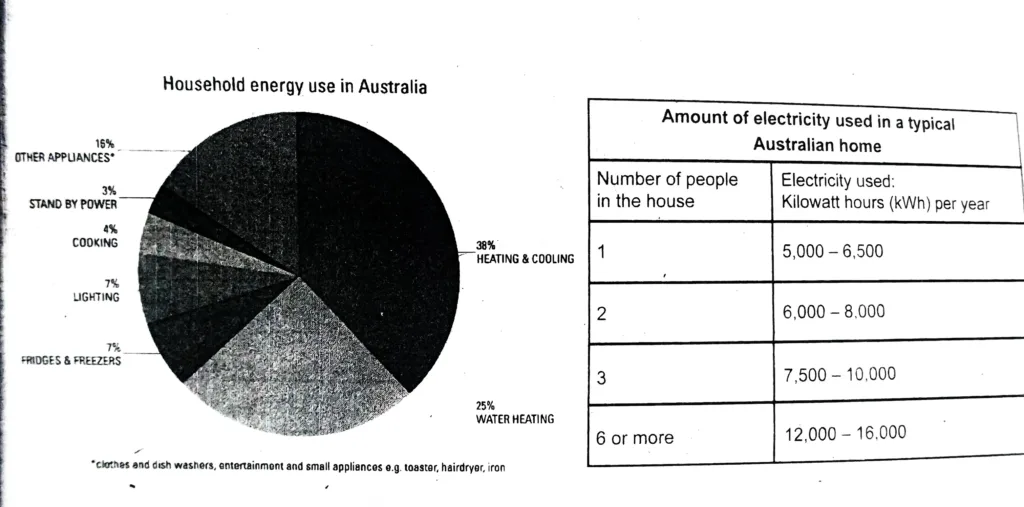
The percentage of energy used by various appliances in a typical Australian home is displayed in a pie chart. The table indicates that as household size increases, the amount of energy used per capita decreases, and the pie chart generally illustrates that temperature control—both for heating and cooling—is the primary user. Water heating is the […]

IELTS WRITING TASK 1 - COMBINATION
COMBINATION

IELTS WRITING TASK 1 – COMBINATION GRAPH

The charts give information about the amount and types of water in the world and also describe the use of water in three areas in three countries. Summarise the information by selecting and reporting the main features and make comparisons where relevant. The provided column graph shows the percentage of fresh water used for each

IELTS WRITING TASK 1 - COMBINATION
COMBINATION

IELTS WRITING TASK 1 – COMBINATION GRAPH

The line graph shows the average prices of tickets sold at a theater, and the bar chart shows the average percentage of tickets sold in 2010 and 2011. Summarise the information by selecting and reporting the main features and make comparisons where relevant. The line graph and column chart that follow show the percentage of

IELTS WRITING TASK 1 - COMBINATION
COMBINATION

IELTS WRITING TASK 1 – COMBINATION GRAPHS

The table and chart show the time spent on leisure and household activities in Britain. Summarise the information by selecting and reporting the main features, and make comparisons where relevant. The bar graph and table below compare the daily amounts of time that men and women in Britain spend on different household chores and leisure

IELTS WRITING TASK 1 - COMBINATION
COMBINATION

IELTS WRITING TASK 1 – COMBINATION GRAPHS

The graphs show the size of the ozone hole over Antarctica and the production of three ozone-damaging gases from 1980 to 2000. Summarise the information by selecting and reporting the main features, and make comparisons where relevant. The provided line graphs show how the size of the ozone hole over the Antarctic region changed from

IELTS WRITING TASK 1 - COMBINATION
COMBINATION

IELTS WRITING TASK 1 – COMBINATION GRAPHS

The first chart shows the percentages of women and men in a country involved in some kinds of home tasks (cooking, cleaning, pet caring, and repairing the house). The second chart shows the amount of time each gender spends on each task per day. Summarise the information by selecting and reporting the main features, and

Scroll to Top