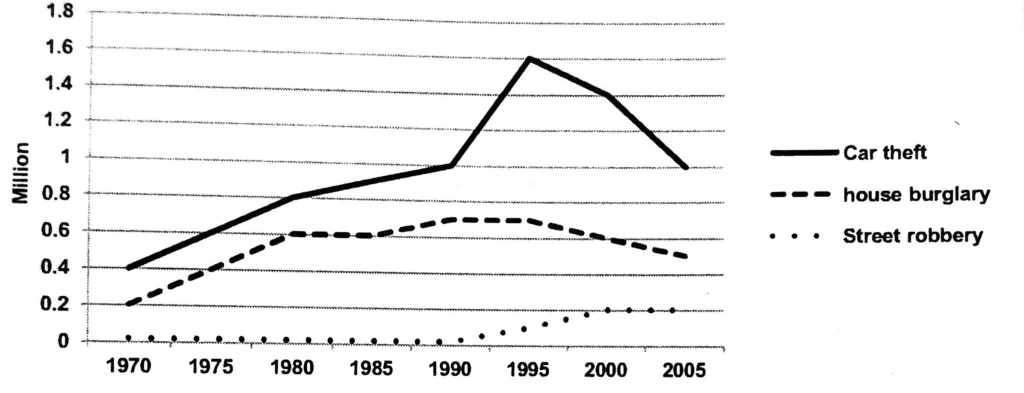
The chart below shows three different types of crime in England and Wales from 1970 to 2005. Summarize the information by selecting and reporting the main features, and make comparisons where relevant.
Three different categories of breaking the law in England and Wales between 1975 and 2005 are compared in the provided line graph. It is evident that all three categories of crime have been trending upward.
Overall, over the course of the 35-year period, reported cases of street robberies were the lowest, and car thefts were the highest.
During the specified time frame, the most car thefts occurred. There were twice as many car thefts reported in 1970 (0.4 million) as there were house burglaries. The number of reported car robberies increased moderately over the next two decades, reaching one million by 1990. From 1990 to 1995, there was a sharp increase in car robberies, reaching a peak of 1.6 million. Thereafter, there was a sharp decline, with car robberies falling to 1 million by 2005.
For the first ten years, house burglaries followed a pattern similar to that of auto thefts; however, after that, they fluctuated and, by 2005, had reached 0.5 million. Approximately 0.01 million street robberies occurred between 1970 and 1990. Then, there was a moderate increase in street robberies, reaching 0.2 million by the year 2000; however, after that, the number of street robberies stabilised.