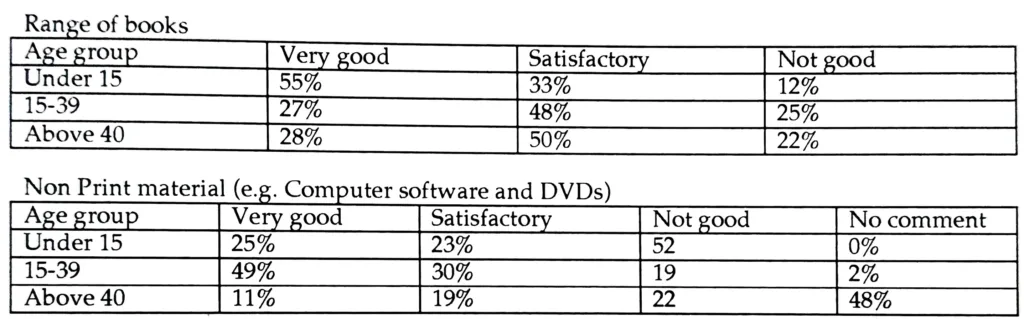
The two tables below show responses of different age groups to a questionnaire with their opinion about the range of books and the non-print material of a local library. summarize the information by selecting and reporting the main features and make comparisons where relevant.
The ratings for print and non-print resources at a nearby library are contrasted in the given table graphs. Overall, nearly 50% of people over 40 would rather remain anonymous when discussing computer software and DVDs.
The responses from people over 40 and those from the 15–39 age group about the variety of books were nearly identical. While slightly more than a quarter of respondents in the other two age groups agreed, nearly half of respondents under 15 rated it as very good. About 50% of people over 15 rated the selection of books as satisfactory, while only 33% of people under 15 thought the same. One in ten children under the age of fifteen expressed dissatisfaction with the selection of books, whereas a quarter of the children in the other two groups thought the selection was poor.
Nearly half of the under-15s expressed dissatisfaction when asked about the non-print material. These resources were rated as very good and satisfactory by 25% of respondents. Of those between the ages of 15 and 39, nearly 50% thought the non-print resources were excellent, 30% were content, and roughly 5% were unhappy with them. Only a tiny percentage of people in this age range remained silent about these resources.
Conversely, slightly less than half of the adults over 40 made no remarks about them. A little over 11% thought these resources were very good, 5% thought they were satisfactory, and a similar percentage thought they were “not good.”